8. DRAG DROP
Note: This question is part of a series of questions that use the same scenario. For your convenience, the scenario is repeated in each question. Each question presents a different goal and answer choices, but the text of the scenario is the same in each question in this series.
Start of repeated scenario
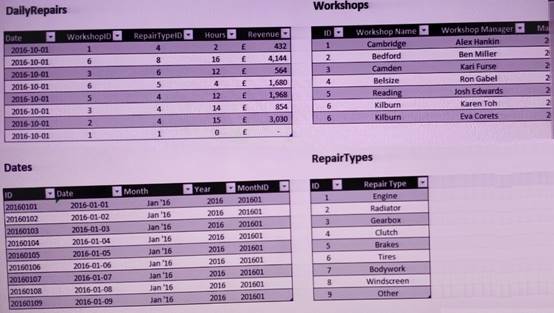
You are creating reports for a car repair company. You have four datasets in Excel spreadsheets. Pour workbook queries load the datasets to a data model. A sample of the data is shown in the Data Sample exhibit.
Data Sample:
The data model is shown in the Data Model exhibit.
Data Model
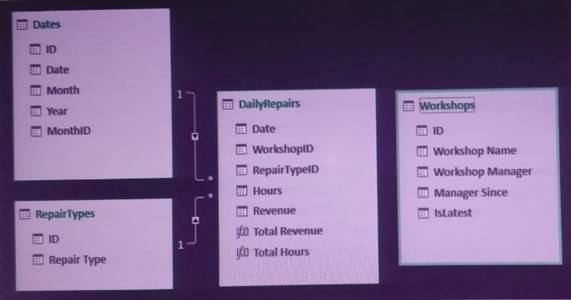
The tables in the model contain the following data:
DailyRepairs has a log of hours and revenue for each day, workshop, and repair type. Every day, a log entry is created for each workshop, even if no hours or revenue are recorded for that day. Total Hours and Total Revenue are two measures denned in DailyRepairs. Total Hours sums the Hours column, and Total Revenue sums the Revenue column.
Workshops has a list of all the workshops and the current and previous workshop managers. The format of the Workshop Manager column is always FirstnameLastname. A value of 1 in the IsLatest column indicates that the workshop manager listed in the record is the current workshop manager.
RepairTypes has a list of all the repair types.
Dates has a list of dates from 2015 to 2018.
End of repeated scenario.
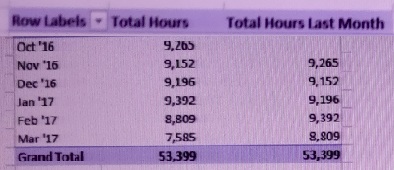
You need to create a PivotChart that displays the month, the hours of the month, and the hours of the previous month, as shown in the following exhibit.
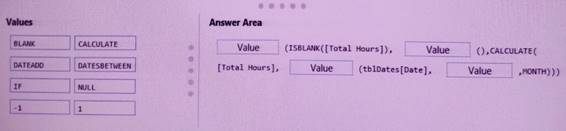
Which DAX formula should you use for the Total Hours Last Month measure? To answer, drag the appropriate values to the correct targets. Each value may be used once, more than once, or not at all. You may need to drag the split bar between panes or scroll to view content.
NOTE: Each correct selection is worth one point.