New DP-100 Microsoft Azure Data Scientist Dumps

DP-100 Designing and Implementing a Data Science Solution on Azure is a new Microsoft Azure exam, which is for Microsoft Certified: Azure Data Scientist Associate certification. Azure Data Scientists apply Azure’s machine learning techniques to train, evaluate, and deploy models that solve business problems. To prove your success in Microsoft DP-100 exam, you need to choose valid study guide. Here we recommend you new DP-100 Microsoft Azure Data Scientist dumps to prepare for your Microsoft DP-100 exam well.

Read DP-100 Free Exam Dumps Online for Microsoft Azure Certified

1. Topic 1, Case Study 1

Overview

You are a data scientist in a company that provides data science for professional sporting events. Models will be global and local market data to meet the following business goals:

•Understand sentiment of mobile device users at sporting events based on audio from crowd reactions.

•Access a user's tendency to respond to an advertisement.

•Customize styles of ads served on mobile devices.

•Use video to detect penalty events.

Current environment

Requirements

• Media used for penalty event detection will be provided by consumer devices. Media may include images and videos captured during the sporting event and snared using social media. The images and videos will have varying sizes and formats.

• The data available for model building comprises of seven years of sporting event media. The sporting event media includes: recorded videos, transcripts of radio commentary, and logs from related social media feeds feeds captured during the sporting events.

•Crowd sentiment will include audio recordings submitted by event attendees in both mono and stereo

Formats.

Advertisements

• Ad response models must be trained at the beginning of each event and applied during the sporting event.

• Market segmentation nxxlels must optimize for similar ad resporr.r history.

• Sampling must guarantee mutual and collective exclusivity local and global segmentation models that share the same features.

• Local market segmentation models will be applied before determining a user’s propensity to respond to an advertisement.

• Data scientists must be able to detect model degradation and decay.

• Ad response models must support non linear boundaries features.

• The ad propensity model uses a cut threshold is 0.45 and retrains occur if weighted Kappa deviates from 0.1 +/-5%.

• The ad propensity model uses cost factors shown in the following diagram:

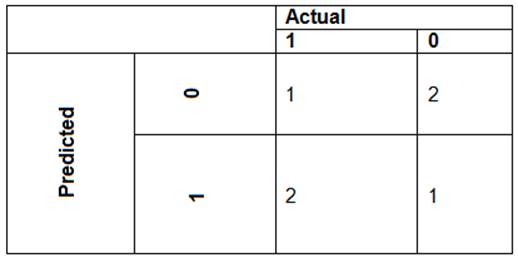
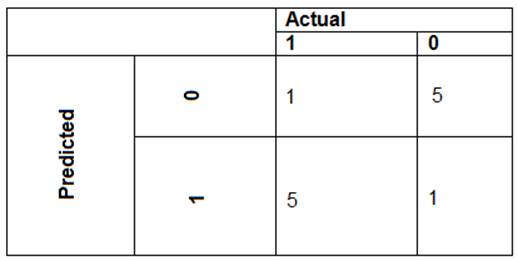
The ad propensity model uses proposed cost factors shown in the following diagram:

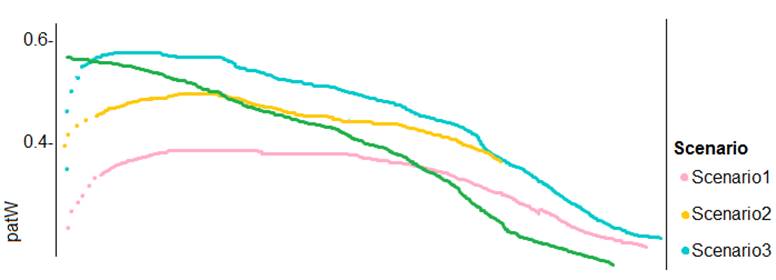
Performance curves of current and proposed cost factor scenarios are shown in the following diagram:

Penalty detection and sentiment

Findings

•Data scientists must build an intelligent solution by using multiple machine learning models for penalty event detection.

•Data scientists must build notebooks in a local environment using automatic feature engineering and model building in machine learning pipelines.

•Notebooks must be deployed to retrain by using Spark instances with dynamic worker allocation

•Notebooks must execute with the same code on new Spark instances to recode only the source of the data.

•Global penalty detection models must be trained by using dynamic runtime graph computation during training.

• Local penalty detection models must be written by using BrainScript.

• Experiments for local crowd sentiment models must combine local penalty detection data.

• Crowd sentiment models must identify known sounds such as cheers and known catch phrases. Individual crowd sentiment models will detect similar sounds.

• All shared features for local models are continuous variables.

• Shared features must use double precision. Subsequent layers must have aggregate running mean and standard deviation metrics Available.

segments

During the initial weeks in production, the following was observed:

•Ad response rates declined.

•Drops were not consistent across ad styles.

•The distribution of features across training and production data are not consistent.

Analysis shows that of the 100 numeric features on user location and behavior, the 47 features that come from location sources are being used as raw features. A suggested experiment to remedy the bias and variance issue is to engineer 10 linearly uncorrected features.

Penalty detection and sentiment

•Initial data discovery shows a wide range of densities of target states in training data used for crowd sentiment models.

•All penalty detection models show inference phases using a Stochastic Gradient Descent (SGD) are running too stow.

•Audio samples show that the length of a catch phrase varies between 25%-47%, depending on region.

•The performance of the global penalty detection models show lower variance but higher bias when comparing training and validation sets. Before implementing any feature changes, you must confirm the bias and variance using all training and validation cases.

You need to resolve the local machine learning pipeline performance issue.

What should you do?

2. DRAG DROP

You need to modify the inputs for the global penalty event model to address the bias and variance issue.

Which three actions should you perform in sequence? To answer, move the appropriate actions from the list of actions to the answer area and arrange them in the correct order.

3. You need to select an environment that will meet the business and data requirements.

Which environment should you use?

4. DRAG DROP

You need to define a process for penalty event detection.

Which three actions should you perform in sequence? To answer, move the appropriate actions from the list of actions to the answer area and arrange them in the correct order.

5. DRAG DROP

You need to define a process for penalty event detection.

Which three actions should you perform in sequence? To answer, move the appropriate actions from the list of actions to the answer area and arrange them in the correct order.

6. DRAG DROP

You need to define an evaluation strategy for the crowd sentiment models.

Which three actions should you perform in sequence? To answer, move the appropriate actions from the list of actions to the answer area and arrange them in the correct order.

7. HOTSPOT

You need to build a feature extraction strategy for the local models.

How should you complete the code segment? To answer, select the appropriate options in the answer area.

NOTE: Each correct selection is worth one point.

8. You need to implement a scaling strategy for the local penalty detection data.

Which normalization type should you use?

9. HOTSPOT

You need to use the Python language to build a sampling strategy for the global penalty detection models.

How should you complete the code segment? To answer, select the appropriate options in the answer area.

NOTE: Each correct selection is worth one point.

10. You need to implement a feature engineering strategy for the crowd sentiment local models.

What should you do?

11. DRAG DROP

You need to define a modeling strategy for ad response.

Which three actions should you perform in sequence? To answer, move the appropriate actions from the list of actions to the answer area and arrange them in the correct order.

12. DRAG DROP

You need to define an evaluation strategy for the crowd sentiment models.

Which three actions should you perform in sequence? To answer, move the appropriate actions from the list of actions to the answer area and arrange them in the correct order.

13. You need to implement a model development strategy to determine a user’s tendency to respond to an ad.

Which technique should you use?

14. You need to implement a new cost factor scenario for the ad response models as illustrated in the

performance curve exhibit.

Which technique should you use?

15. Topic 2, Case Study 2

Case study

Overview

You are a data scientist for Fabrikam Residences, a company specializing in quality private and commercial property in the United States. Fabrikam Residences is considering expanding into Europe and has asked you to investigate prices for private residences in major European cities. You use Azure Machine Learning Studio to measure the median value of properties. You produce a regression model to predict property prices by using the Linear Regression and Bayesian Linear Regression modules.

Datasets

There are two datasets in CSV format that contain property details for two cities, London and Paris, with the following columns:

The two datasets have been added to Azure Machine Learning Studio as separate datasets and included as the starting point of the experiment.

Dataset issues

The AccessibilityToHighway column in both datasets contains missing values. The missing data must be replaced with new data so that it is modeled conditionally using the other variables in the data before filling in the missing values.

Columns in each dataset contain missing and null values. The dataset also contains many outliers. The Age column has a high proportion of outliers. You need to remove the rows that have outliers in the Age column. The MedianValue and AvgRoomsinHouse columns both hold data in numeric format. You need to select a feature selection algorithm to analyze the relationship between the two columns in more detail.

Model fit

The model shows signs of overfitting. You need to produce a more refined regression model that reduces the overfitting.

Experiment requirements

You must set up the experiment to cross-validate the Linear Regression and Bayesian Linear Regression modules to evaluate performance.

In each case, the predictor of the dataset is the column named MedianValue. An initial investigation showed that the datasets are identical in structure apart from the MedianValue column. The smaller Paris dataset contains the MedianValue in text format, whereas the larger London dataset contains the MedianValue in numerical format. You must ensure that the datatype of the MedianValue column of the Paris dataset matches the structure of the London dataset.

You must prioritize the columns of data for predicting the outcome. You must use non-parameters statistics to measure the relationships.

You must use a feature selection algorithm to analyze the relationship between the MedianValue and AvgRoomsinHouse columns.

Model training

Given a trained model and a test dataset, you need to compute the permutation feature importance scores of feature variables. You need to set up the Permutation Feature Importance module to select the correct metric to investigate the model’s accuracy and replicate the findings.

You want to configure hyperparameters in the model learning process to speed the learning phase by using hyperparameters. In addition, this configuration should cancel the lowest performing runs at each evaluation interval, thereby directing effort and resources towards models that are more likely to be successful.

You are concerned that the model might not efficiently use compute resources in hyperparameter tuning. You also are concerned that the model might prevent an increase in the overall tuning time. Therefore, you need to implement an early stopping criterion on models that provides savings without terminating promising jobs.

Testing

You must produce multiple partitions of a dataset based on sampling using the Partition and Sample module in Azure Machine Learning Studio. You must create three equal partitions for cross-validation. You must also configure the cross-validation process so that the rows in the test and training datasets are divided evenly by properties that are near each city’s main river. The data that identifies that a property is near a river is held in the column named NextToRiver. You want to complete this task before the data goes through the sampling process.

When you train a Linear Regression module using a property dataset that shows data for property prices for a large city, you need to determine the best features to use in a model. You can choose standard metrics provided to measure performance before and after the feature importance process completes. You must ensure that the distribution of the features across multiple training models is consistent.

Data visualization

You need to provide the test results to the Fabrikam Residences team. You create data visualizations to aid in presenting the results.

You must produce a Receiver Operating Characteristic (ROC) curve to conduct a diagnostic test evaluation of the model. You need to select appropriate methods for producing the ROC curve in Azure Machine Learning Studio to compare the Two-Class Decision Forest and the Two-Class Decision Jungle modules with one another.

DRAG DROP

You need to implement early stopping criteria as suited in the model training requirements.

Which three code segments should you use to develop the solution? To answer, move the appropriate code segments from the list of code segments to the answer area and arrange them in the correct order.

NOTE: More than one order of answer choices is correct. You will receive credit for any of the correct orders you select.

16. HOTSPOT

You need to identify the methods for dividing the data according, to the testing requirements.

Which properties should you select? To answer, select the appropriate option-, m the answer area. NOTE: Each correct selection is worth one point.

17. HOTSPOT

You need to configure the Permutation Feature Importance module for the model framing requirements.

What should you do? To answer, select the appropriate options in the dialog box in the answer area-NOTE: Each correct selection is worth one point.

18. HOTSPOT

You need to configure the Edit Metadata module so that the structure of the datasets match.

Which configuration options should you select? To answer, select the appropriate options in the answer area.

NOTE: Each correct selection is worth one point.

19. DRAG DROP

You need to correct the model fit issue.

Which three actions should you perform in sequence? To answer, move the appropriate actions from the list of actions to the answer area and arrange them in the correct order.

20. DRAG DROP

You need to visually identify whether outliers exist in the Age column and quantify the outliers before the outliers are removed.

Which three Azure Machine Learning Studio modules should you use in sequence? To answer, move the appropriate modules from the list of modules to the answer area and arrange them in the correct order.

21. HOTSPOT

You need to replace the missing data in the AccessibilityToHighway columns.

How should you configure the Clean Missing Data module? To answer, select the appropriate options in the answer area.

NOTE: Each correct selection is worth one point.

22. DRAG DROP

You need to produce a visualization for the diagnostic test evaluation according to the data visualization requirements.

Which three modules should you recommend be used in sequence? To answer, move the appropriate modules from the list of modules to the answer area and arrange them in the correct order.

23. HOTSPOT

You need to set up the Permutation Feature Importance module according to the model training requirements.

Which properties should you select? To answer, select the appropriate options in the answer area.

NOTE: Each correct selection is worth one point.

24. HOTSPOT

You need to configure the Feature Based Feature Selection module based on the experiment requirements and datasets.

How should you configure the module properties? To answer, select the appropriate options in the dialog box in the answer area.

NOTE: Each correct selection is worth one point.

25. You need to select a feature extraction method.

Which method should you use?

26. Topic 3, Mix Questions

Note: This question is part of a series of questions that present the same scenario. Each question in the series contains a unique solution that might meet the stated goals. Some question sets might have more than one correct solution, while others might not have a correct solution.

After you answer a question in this section, you will NOT be able to return to it. As a result, these questions will not appear in the review screen.

You are analyzing a numerical dataset which contains missing values in several columns.

You must clean the missing values using an appropriate operation without affecting the dimensionality of the feature set.

You need to analyze a full dataset to include all values.

Solution: Replace each missing value using the Multiple Imputation by Chained Equations (MICE) method.

Does the solution meet the goal?

27. Note: This question is part of a series of questions that present the same scenario. Each question in the series contains a unique solution that might meet the stated goals. Some question sets might have more than one correct solution, while others might not have a correct solution.

After you answer a question in this section, you will NOT be able to return to it. As a result, these questions will not appear in the review screen.

You are analyzing a numerical dataset which contains missing values in several columns.

You must clean the missing values using an appropriate operation without affecting the dimensionality of the feature set.

You need to analyze a full dataset to include all values.

Solution: Remove the entire column that contains the missing data point.

Does the solution meet the goal?

28. Note: This question is part of a series of questions that present the same scenario. Each question in the series contains a unique solution that might meet the stated goals. Some question sets might have more than one correct solution, while others might not have a correct solution.

After you answer a question in this section, you will NOT be able to return to it. As a result, these questions will not appear in the review screen.

You are analyzing a numerical dataset which contain missing values in several columns.

You must clean the missing values using an appropriate operation without affecting the dimensionality of the feature set.

You need to analyze a full dataset to include all values.

Solution: Use the last Observation Carried Forward (IOCF) method to impute the missing data points.

Does the solution meet the goal?

29. Note: This question is part of a series of questions that present the same scenario. Each question in the series contains a unique solution that might meet the stated goals. Some question sets might have more than one correct solution, while others might not have a correct solution.

After you answer a question in this section, you will NOT be able to return to it. As a result, these questions will not appear in the review screen.

You are creating a new experiment in Azure Machine Learning Studio.

One class has a much smaller number of observations than the other classes in the training set.

You need to select an appropriate data sampling strategy to compensate for the class imbalance.

Solution: You use the Scale and Reduce sampling mode.

Does the solution meet the goal?

30. Note: This question is part of a series of questions that present the same scenario. Each question in the series contains a unique solution that might meet the stated goals. Some question sets might have more than one correct solution, while others might not have a correct solution.

After you answer a question in this section, you will NOT be able to return to it. As a result, these questions will not appear in the review screen.

You are creating a new experiment in Azure Learning learning Studio.

One class has a much smaller number of observations than the other classes in the training

You need to select an appropriate data sampling strategy to compensate for the class imbalance.

Solution: You use the Synthetic Minority Oversampling Technique (SMOTE) sampling mode.

Does the solution meet the goal?

31. Note: This question is part of a series of questions that present the same scenario. Each question in the series contains a unique solution that might meet the stated goals. Some question sets might have more than one correct solution, while others might not have a correct solution.

After you answer a question in this section, you will NOT be able to return to it. As a result, these questions will not appear in the review screen.

You are creating a new experiment in Azure Machine Learning Studio.

One class has a much smaller number of observations than tin- other classes in the training set.

You need to select an appropriate data sampling strategy to compensate for the class imbalance.

Solution: You use the Principal Components Analysis (PCA) sampling mode.

Does the solution meet the goal?

32. Note: This question is part of a series of questions that present the same scenario. Each question in the series contains a unique solution that might meet the stated goals. Some question sets might have more than one correct solution, while others might not have a correct solution.

After you answer a question in this section, you will NOT be able to return to it. As a result, these questions will not appear in the review screen.

You are a data scientist using Azure Machine Learning Studio.

You need to normalize values to produce an output column into bins to predict a target column.

Solution: Apply an Equal Width with Custom Start and Stop binning mode.

Does the solution meet the goal?

33. Note: This question is part of a series of questions that present the same scenario. Each question in the series contains a unique solution that might meet the stated goals. Some question sets might have more than one correct solution, while others might not have a correct solution.

After you answer a question in this section, you will NOT be able to return to it. As a result, these questions will not appear in the review screen.

You are a data scientist using Azure Machine Learning Studio.

You need to normalize values to produce an output column into bins to predict a target column.

Solution: Apply a Quantiles normalization with a QuantileIndex normalization.

Does the solution meet the GOAL?

34. Note: This question is part of a series of questions that present the same scenario. Each question in the series contains a unique solution that might meet the stated goals. Some question sets might have more than one correct solution, while others might not have a correct solution.

After you answer a question in this section, you will NOT be able to return to it. As a result, these questions will not appear in the review screen.

You are using Azure Machine learning Studio to perform feature engineering on a dataset. You need to normalize values to produce a feature column grouped into bins.

Solution: Apply an Entropy Minimum Description Length (MDI) binning mode.

Does the solution meet the goal?

35. You are conducting feature engineering to prepuce data for further analysis.

The data includes seasonal patterns on inventory requirements.

You need to select the appropriate method to conduct feature engineering on the data.

Which method should you use?

36. You are solving a classification task.

The dataset is imbalanced.

You need to select an Azure Machine Learning Studio module to improve the classification accuracy.

Which module should you use?

37. DRAG DROP

You are producing a multiple linear regression model in Azure Machine learning Studio.

Several independent variables are highly correlated.

You need to select appropriate methods for conducting elective feature engineering on all the data.

Which three actions should you perform in sequence? To answer, move the appropriate Actions from the list of actions to the answer area and arrange them in the correct order.

38. You are performing a filter based feature selection for a dataset 10 build a multi class classifies by using Azure Machine Learning Studio.

The dataset contains categorical features that are highly correlated to the output label column.

You need to select the appropriate feature scoring statistical method to identify the key predictors.

Which method should you use?

39. HOTSPOT

You create a binary classification model to predict whether a person has a disease. You need to detect possible classification errors.

Which error type should you choose for each description? To answer, select the appropriate options in the answer area.

NOTE: Each correct selection is worth one point.

40. You plan to use a Data Science Virtual Machine (DSVM) with the open source deep learning frameworks Caffe2 and Theano. You need to select a pre configured DSVM to support the framework.

What should you create?

41. You are a data scientist creating a linear regression model.

You need to determine how closely the data fits the regression line.

Which metric should you review?

42. You plan to use .a Deep learning Virtual Machine (DLVM) to train deep learning models using Compute Unified Device Architecture (CUDA) computations.

You need to configure the IXVM to support CUOA

What should you implement?


Microsoft 365 Fundamentals MS-900 Study Guide
Updated 70-767 Microsoft Exam Questions